Are you trying to determine how much to spend on marketing this year or maybe need advertising ideas on what types to utilize? The following data offers a good starting point that shows where small businesses from a variety of categories place their advertising dollars. Find details annual budget trends for advertising spending.
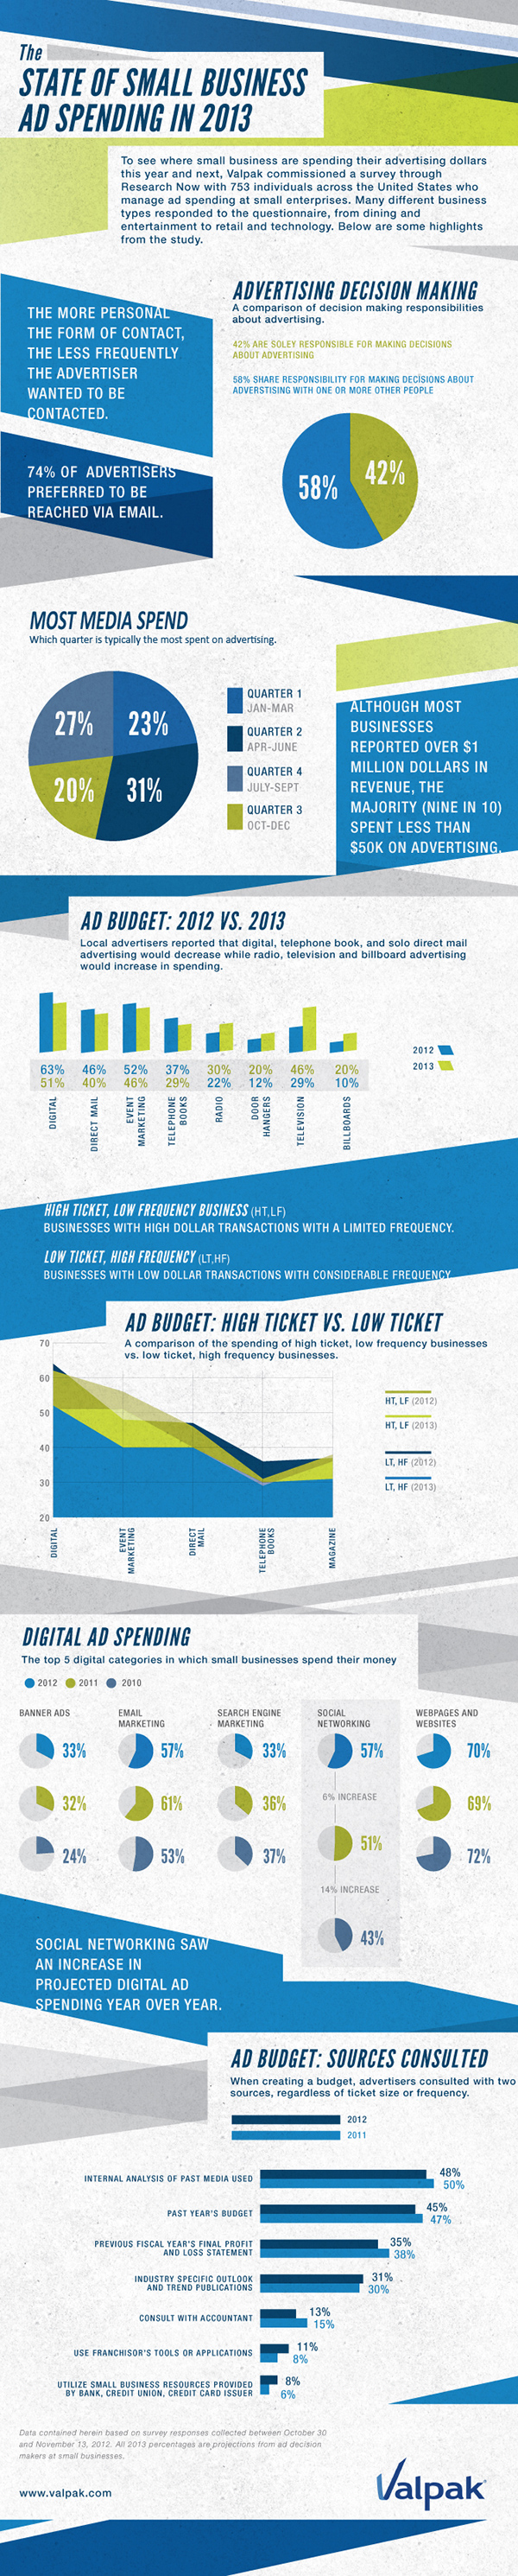
It might surprise you to know that a majority of small businesses with over $1 million in revenues are only dedicating $50,000 of their revenue to a marketing budget. A majority of the ad budget was spent in the second quarter, months April through June.
As far as where the advertising dollars are being spent, a majority of high frequency low dollar transaction businesses put their ad budget towards direct mail, telephone books and magazine advertisement. In comparison, the lower frequency high dollar transaction companies dedicate these funds to advertising online with digital and event marketing with some direct mailing as well.
Take a look at the ad spending 2010 through 2012 to gain insights on where a majority of small businesses are spending their digital marketing dollars. The highest performing category year over year proved to come from websites and webpages while the greatest increase came from social networking. Out of the top five digital marketing categories, these small businesses utilized a social media budget for items like Facebook advertising and other social networking in order to attract consumers with a 14% increase from 2010 to 2011, and a 6% increase from 2011 to 2012.
When determining their marketing budget, most small businesses consulted prior year’s media used as well as the past year’s marketing budget. These two categories dominated the overall results from 2011 to 2012, while the previous year’s profit and loss statement came in third. Only 30% in 2011 and 31% in 2012 ventured to use an industry specific outlook and trending publications, though this topic has shown an increase year over year.